On the heels of my earlier mission to discover the perfect facepalm, I thought it a good time to examine the relationship between WAR and wins a little further. As far as a simple man such as myself can go, that is.
Is WAR really a better indicator of team success than Pythagorean record? It would seem so, on the surface. Neither measure is perfect, but they must come close to predicting/indicating the true talent of a team. Let's see. My wasted morning at work lies below (click to embiggen):

You see the R squared is 0.6818, or a reasonable connection between WAR wins and actual wins. The Jays and Rays are the real outliers here, badly missing their projected win totals. Notice the Yankees and Red Sox bang on the line.
Does it seem as though the bad teams (or at least, the worse teams) are further from the line to you? Does this speak to luck being the only, true differentiator between the wide swath of mediocre teams in baseball?
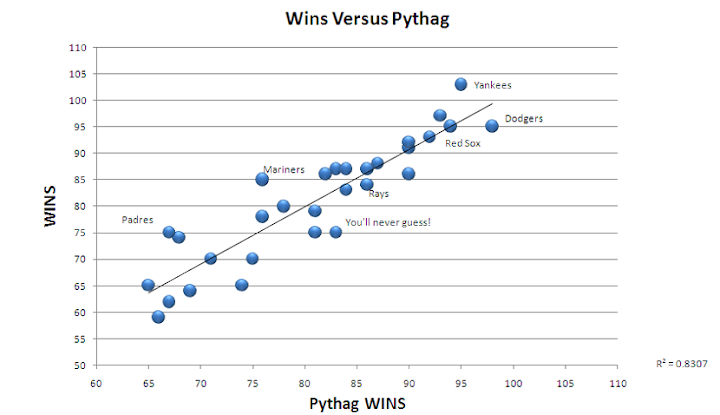
What about Pythag record? What is the relationship like here?

Well shit. As much as I wanted WAR to be the more accurate of the two; it just isn't so in 2009. Pythag has a much stronger C.O.D. and it, every so slightly, breaks my heart.
Does this mean I'm going to become of an Amish Luddite and swear off technology and its awful minions? Hardly. I still think WAR is a great tool for evaluating individual players but in the team setting it breaks down slightly. Despite our best attempts, it is a human game. Timing is everything, and that is okay.
As for our fateful Blue Jays, king kommenter SP (who also suggested the two divisions thing a while back) made a great and salient point in the comments of the previous post:
As for the luck thing. It still boggles the mind. How can they be so monumentally unlucky 4 straight years? This stuff is supposed to correct itself over time, right?What do we do? The Rays had extreme bad luck this year, one season after outperforming their Pythag (by 4) but nailed their true talent wins (96.9 WAR and 97 total wins)? I don't have that answer, but I'm going to try and find out.
It's not like things haven't changed either. The bad luck has persisted through 2 very different coaching regimes, 3 hitting coaches, with good to great pitching, defense, and fielding in each of those years.
What kind of things did the Jays and Rays have in common this year? What was different between the 08 and 09 Rays? Stay tuned, as they say.
All WAR data courtesy of Fangraphs and Pythag stuff via Baseball Reference. Doing the Lord's work

I forgot my tinfoil hat today, so I'm just going to throw this out there: Is "bad luck" in the AL East synonymous with "umps favouring the Red Sox and Yankees"?
ReplyDeleteNo. For WAR, the most likely explanation is poor RISP.
ReplyDeleteGreat stuff here. I think you're using that alchemy that will turn an O-Dog Combo into a Chateau Briand.
ReplyDeleteA couple of quick points here:
Wondering what happens to Pythagorean records if they are normalized slightly, as in: You take the team's biggest positive and negative run differentials, and exclude them from the equation.
The thought being that a 22-1 shellacking of some team or at the hands of some team will skew those numbers quite a bit for the rest of the season.
As for the "unluckiness" of the Rays and Jays...I think we probably have a pretty good idea of why they are so damned unlucky.
(And a further area for examination might be what the records are for the Jays, Rays and maybe O's in the series after they face the pitch-seeing, bullpen working Sawx and Yanks. If they leave those series with bullpens that are shot all to hell year in and year out, then maybe that might begin to explain the run of "bad luck".)
Also: The Twins are as plucky as all fuck out, but watching them in that series against the Yanks, I couldn't help but think the J.P. didn't need to follow their model BECAUSE HE'D ALREADY BUILT A BETTER TEAM.
Maybe if Morneau is in that lineup, I feel differently...but really: Brian Duneuensuenening? Carl Pavano?
(Sorry...I shouldn't highjack this very interesting discussion with my whiny bitching.)
Bring on the numbers!
Bitching graphs. Great post. Long live nerditry.
ReplyDelete@jw - you think RISP brings the entire team's WAR down?
ReplyDeleteThe Jays ranked 21st in OPS with runners in scoring position, but the Rays ranked 7th! Debunked?
@Tao - I agree. I'll likely expand on this over the coming weeks and months, but J.P. built excellent teams, over and again. Better than many teams with far larger budgets and easier schedules.
He didn't do it on his own though. Hopefully AA can build on the stout foundations and add that missing piece. Hopefully I'll figure out what that piece is and he'll give me a job. Uh, I mean...damn the man!
Looking at the Twins lineup in Game 3 was akin to using a wet noodle as a weapon of choice to hurt someone.
ReplyDeleteThe Pythagorean record is one that I use and reference if only because it's relatively simple. I'm not sure if WAR, or at least the original incantation of WAR, takes into account that a cumulative average to determine a value is underplaying the effect of that particular year. For example, is the 2009 season exactly the same as 2006, thus, safe to assume those years are equalized without variation? What about the differences between the AL and NL in terms of playing difficulty? I have a feeling WAR does deal with the aforementioned concerns and come out more accurate(?) than even Pythag, but I'm just guessing.
WAR indeed does that. For example, a team of replacement players would have won 47.4 games last year, but only 46 this year. (as per USSM and some other smart folk.)
ReplyDeletewOBA is used to calculate the Batting Runs portion and it's adjusted for ballpark and league. So WAR is pretty accurate and context neutral, sadly (well, if I'm being honest, awesomely) the official standings do not.
Didn't Bill James have a theory that managers might be at least partly (if not mostly) responsible for a team over- or under-performing their pythag? Add that to the divisional disadvantage that the Jays have, and wouldn't that account for most of these lost wins?
ReplyDelete"Lost Wins."
ReplyDeleteI'm not sure I've heard of a better way to describe the Toronto Blue Jays.
I came for the picture, I stayed for the content.
ReplyDeleteNice work Poindexter.
I think pitchers with high line drive rates can pull down your performance relative to WAR. Pitchers are scored by FIP, not tRA, so line drives don't count against the pitcher (because they're in play and thus not defense-independent), and they don't count against the fielders (because on average they only make a play 25% of the time), but they do count against the likelihood of winning the game because they're hits much more often than other balls in play.
ReplyDeleteDrew, I'm guessing you've read this guy's Twitter: http://twitter.com/walshjon, where he posts some great stats about payroll efficiency and average team WAR. In the last 4 years, the Jays have been 3rd in the AL in average WAR. And 5th in payroll efficiency: "AL teams, last 4 years, WAR/$10MM: Rays 8.94, Twins 5.91, Indians 5.72, Rangers 5.21,Jays 5.1,As 4.88,Royals 4.69,BoSox 3.94,..., NYY 2.47."
ReplyDeleteJust realized I said "pitching, defense, and fielding" in that comment you quoted. I meant to say bullpen instead of defense.
ReplyDeleteGreat work here, Drew. It's good to see that the Blue Jays aren't the MOST unluckiest team in the league. Hurrah!
ReplyDeleteCool stuff, what do you think of this off-season target? Felipe...
ReplyDeleteWell, the Jays pretty much went into a 2.5 month funk which essentially killed any WAR values that were accumulating. The Jays were probably also the highest WAR with the lowest payroll (or close).
ReplyDeleteLloyd, you sound like a little girl whining about why she lost the beauty pageant. The Yankees and Red Sox are just great franchises, storied teams with a great fan base and great development and scouting. Good luck defending your pretty little numbers against a 19-game winner like CC, or a 120 RBI guy like Tex!
ReplyDeleteI resent your sad trolling attempts Ken. I expect better.
ReplyDelete